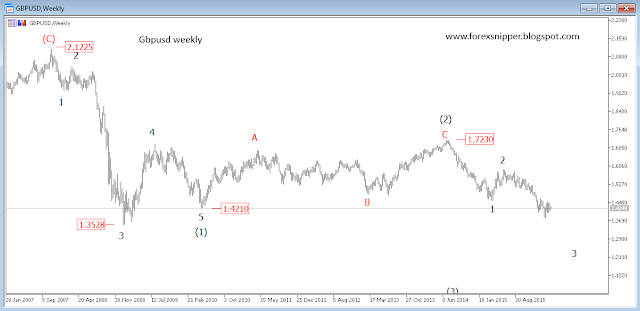
The bearishness of the cable started late 2007 after a long term bullish correction that ended at 2.1225. It wasn't unexpected - a trend often continues after a correction and Elliott wave theory among many other things, helps to distinguish between a trend and a correction.
Price dipped from 2.1225 to 1.4210 in an impulse wave with a truncated sub-wave 5. We saw a zigzag correction afterward to 1.7230 though shallow.
The continued dip from 1.7230 is meant to be a wave (3) and if for no other reason, the sub-wave 1 of (3) is strong.
The strength of the dollar to pound is expected to continue in a move that could make a pound sterling go for less than a dollar.
Presently, the sub-wave 3 of the 3rd wave is still in motion.
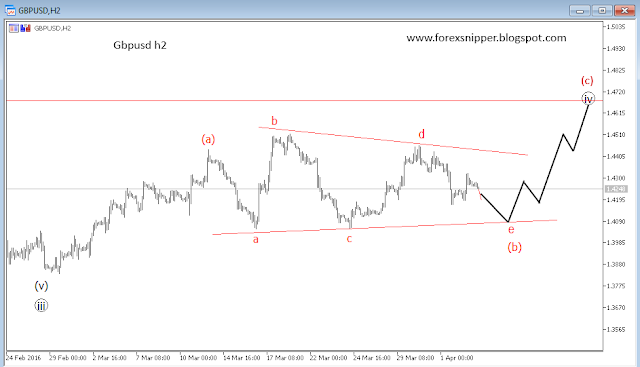
The chart below shows that this sub-wave 3 is maybe correcting for the last time before it completes its phase a long way below 1.3831.
The question now is- "do we have a corrective pattern to show that its 4th wave has concluded?".
More often than not, wave 4 corrects to the 4th sub-wave of wave 3 of the same degree. So there is a possibility of the cable rallying to 1.4669 and its neighborhood before it completes its phase downward.
The chart below also shows a possible emerging pattern ( a zigzag pattern with a triangle as the second leg) to support a probable short term rally to 1. 4669 (after the completion of the triangle) before the long term dip continues.
Intraday Expectation: The 15m chart below shows that the last leg of the triangle wave e could be a double zigzag pattern and is expected to end above 1.4080.
We will wait for price to get to this level and see what happens from there.
Subscribe to our mailing list to alert you early.


No comments:
Post a Comment